
· Codemax · 6 min read
Closing October: five ops numbers to pull before you plan 2027
October is the last clean month before the year-end peaks. Five operations numbers to pull from its close, how to calculate each one, and how to turn them into 2027 targets.
TL;DR
Before planning 2027, pull five restaurant KPIs from October's close: the gap between actual and theoretical food cost percentage, wastage rate, stock cover in days, purchase price variance and central kitchen fill rate. Pull them by outlet for August to October, using the same definitions everywhere, and set 2027 targets from the trend and your best outlets rather than one good month.
- October is the last month before Deepavali, 11.11 and year-end distort the numbers.
- The gap between actual and theoretical food cost matters more than the percentage itself.
- Stock cover in days shows how much cash sits on shelves, and how much expiry risk.
- Fill rate tells you whether the central kitchen can carry next year's growth.
- Set targets from your own best outlets, with an owner and an action for each.
Before you plan 2027, pull five restaurant KPIs from October’s close: the gap between actual and theoretical food cost, wastage rate, stock cover in days, purchase price variance and central kitchen fill rate. Together they show where margin is leaking, how much cash sits on shelves and whether your supply chain can carry next year’s plans. Pull them by outlet for August to October, using the same definitions everywhere, and set targets from the trend rather than a single good month.
These are operations numbers. Sales, labour and marketing figures belong in the same planning pack, but they usually come from other teams. The five below are the ones operations owns.
Why October is the right month to pull them
October is the last clean month of 2026. From early November, Deepavali on Sunday 8 November, 11.11 promotions on Wednesday 11 November and year-end catering will distort sales, stock and waste in ways that make comparisons hard. A November number tells you how the peak went. An October number tells you how the business runs.
It is also early enough to act. Targets agreed in November can be built into recipes, par levels and supplier terms before January, rather than discovered as a problem in the first quarter.
What are restaurant KPIs for operations?
Restaurant KPIs (key performance indicators) are a small set of measures, calculated the same way every period, that show whether an F&B operation is running to plan. Operations KPIs focus on what the kitchen, stores and supply chain directly control: the cost of goods, waste, stock, buying and supply to outlets.
The test of a good KPI is that a named person can change it. Food cost percentage on its own fails that test; it moves with price, mix and portioning at once. The gap between actual and theoretical food cost passes it, because it isolates what happened in the kitchen.
The five numbers and how to calculate them
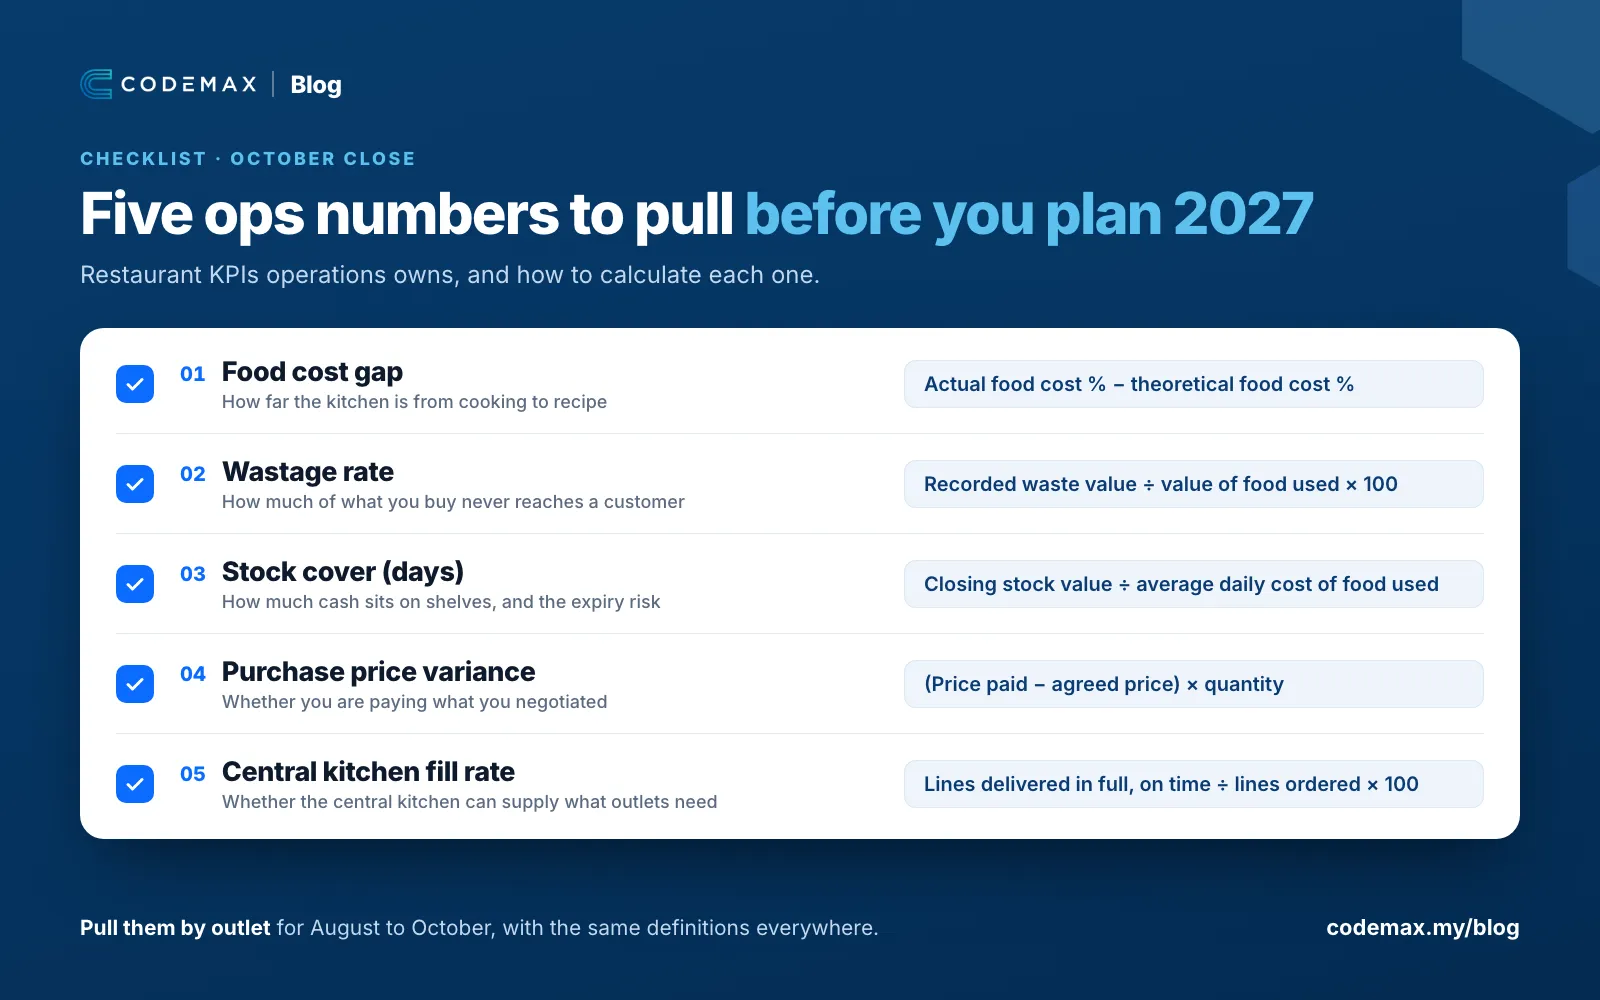
| KPI | How to calculate it | What it tells you |
|---|---|---|
| Food cost gap | Actual food cost % minus theoretical food cost % | How far the kitchen is from cooking to recipe |
| Wastage rate | Value of recorded waste ÷ value of food used × 100 | How much of what you buy never reaches a customer |
| Stock cover (days) | Closing stock value ÷ average daily cost of food used | How much cash sits on shelves, and the expiry risk |
| Purchase price variance | (Price paid − agreed price) × quantity, by supplier and item | Whether you are paying what you negotiated |
| Central kitchen fill rate | Order lines delivered in full and on time ÷ order lines placed × 100 | Whether the central kitchen can supply what outlets need |
Food cost gap. Actual food cost percentage is opening stock plus purchases minus closing stock, divided by food sales. Theoretical is the recipe cost of what was sold, divided by the same sales. If ingredient prices moved this year, our piece on keeping costing up to date when prices change weekly explains why the theoretical side needs current recipe costs to mean anything.
Wastage rate. Only recorded waste counts, which is why the rate is only as good as the logging behind it. Break it down by stage and reason, as set out in our guide to where food waste hides.
Stock cover. A rising number of days on hand ties up cash and raises the chance of expiry. A falling one can mean tighter control or more stock-outs. Read it alongside the count variance from your month-end stock take.
Purchase price variance. Small differences between agreed and invoiced prices add up across hundreds of lines a month. Our piece on supplier price versus price paid covers where those gaps come from.
Central kitchen fill rate. Outlets that don’t get what they ordered buy locally, substitute or run out. All three cost more than the original order.
How do you pull them without a spreadsheet marathon?
- Close October properly first. Finish the stock take, post every receipt and transfer, and record October’s wastage before you pull anything.
- Agree the definitions once. Write down how each KPI is calculated and apply the same formula to every outlet and the central kitchen.
- Pull three months, not one. August to October shows whether a number is a trend or a blip.
- Break it down by outlet and by your top 20 items. Network averages hide the outlets doing much better and much worse.
- Flag the outliers. Mark the outlets and items furthest from the network median on each KPI.
- Write one sentence per KPI. “Food cost gap widened at four outlets, all on chicken” is a planning input. A spreadsheet with no sentence is not.
How should these numbers shape 2027 planning?
Set targets from your own best performers, not from industry rules of thumb. If your best five outlets run a food cost gap a third the size of the rest, that is a target you know is achievable in your own kitchens, on your own menu.
Give every target an action and an owner. “Reduce wastage rate” is a wish. “Cut end-of-day waste on fresh bakery at eight outlets by matching the bake schedule to the hour, owned by the area manager” is a plan.
Fix the cheapest problems first. A food cost gap or a price variance is margin you have already paid for and lost; closing it is worth more than most price rises, and costs customers nothing. Then decide what the central kitchen’s fill rate needs to be for 2027’s new outlets or menu, and plan capacity before those outlets open, not after.
Where RMS and the AI-Kitchen Command Center fit
Codemax RMS (Resource Management System) calculates most of these numbers as the month runs. Recipes and multi-level BOMs give every sale a theoretical usage, and a change in ingredient cost automatically re-costs the dishes affected. Live stock-on-hand, wastage and theoretical-versus-actual variance are recorded by outlet and item. Outlet orders, central kitchen dispatch and outlet receiving sit in one system, so ordered and delivered quantities can be compared line by line. Finance stays in step through ERP and accounting sync with SAP, Oracle NetSuite, Microsoft Dynamics 365 and Xero.
The AI-Kitchen Command Center watches every outlet, product and shift against its own baseline and flags drift before it reaches the P&L. Its AI agent chat answers questions such as “which five outlets had the widest food cost gap in October?” in plain language, with the underlying records traceable, and narrative reports can go out by email or WhatsApp ahead of the planning meeting.
Questions worth asking before the planning meeting
- Is October fully closed — counted, posted and reconciled — at every outlet and the central kitchen?
- Does every outlet calculate food cost and wastage the same way?
- Which three outlets had the widest food cost gap over the last three months, and why?
- How many days of stock are we holding, and how much of it is short-dated?
- What fill rate will the central kitchen need to supply 2027’s outlets?
If the answers take more than a morning to find, the first 2027 target is a reporting one.
Frequently asked questions
What are the most important KPIs for a restaurant?
The most important restaurant KPIs for operations are food cost percentage compared with theoretical food cost, wastage rate, stock cover in days, purchase price variance and, for groups with a central kitchen, fill rate to outlets. Sales and labour KPIs matter too, but these five show what operations directly controls: cost of goods, waste, stock, buying and supply.
How do you calculate food cost percentage?
Food cost percentage is the cost of food used divided by food sales, multiplied by 100. The cost of food used is opening stock plus purchases minus closing stock for the period. Compare it with theoretical food cost percentage, which is the recipe cost of the items actually sold divided by the same food sales.
What is a good food cost percentage for a restaurant in Malaysia?
There is no single good food cost percentage for every restaurant in Malaysia, because it depends on the format, menu, pricing and channel mix. A more useful test is the gap between actual and theoretical food cost for your own menu. A gap that is small and stable means the kitchen is cooking to recipe; a growing gap needs investigating.
How do you calculate wastage rate in F&B?
Wastage rate in F&B is the value of recorded food waste divided by the value of food used in the same period, multiplied by 100. Record each write-off with its stage, such as receiving, storage, production or end of day, and a reason code, so the rate can be broken down and the largest repeat causes fixed first.
What is central kitchen fill rate?
Central kitchen fill rate is the share of outlet order lines delivered in full and on time, out of all order lines outlets placed in the period. A falling fill rate means outlets are receiving less than they asked for, or later, which shows up as stock-outs, emergency local buying and lost sales at the outlet.
Start 2027 with numbers everyone trusts.
See how Codemax RMS calculates food cost, wastage and variance as you go, and how the AI-Kitchen Command Center flags outlets drifting from plan.
Related reading
- World Food Day: where food waste hides in your operation A stage-by-stage map of where waste hides in a central kitchen and outlet network, what to measure at each stage, and how to start a waste log that people actually use.
- Three-day weekend, three-day rush: an outlet checklist for Deepavali Deepavali on Sunday 8 November gives most of Malaysia a three-day weekend. A practical checklist for outlet managers on rosters, stock and on-the-day monitoring, state by state.
- Month-end stock take without the spreadsheet chaos Most month-end counts go wrong before anyone picks up a clipboard. A seven-step process for restaurants and central kitchens that produces numbers finance can actually use.